
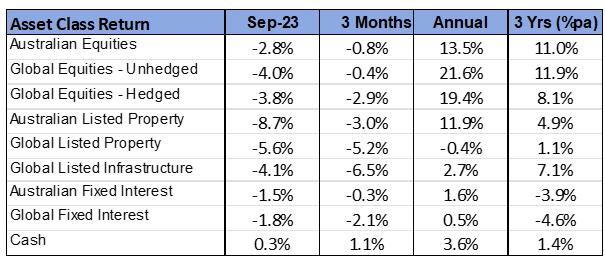
– September Market Snapshot –
- Global share markets sold off for the second consecutive month over September.
- As was the case in August, rising bond yields were the major catalyst for weaker share markets.
- The more interest rate sensitive sectors of infrastructure & property continued to underperform.
International Equities
The re-emergence of inflation concerns, and the ongoing strength of the United States economy, once again led to a recalibration of interest rate expectations last month. Market consensus has swung towards a view that existing elevated cash interest rates will need to be maintained for some time, with central banks having minimal scope to cut interest rates in 2024. A key part of the rationale for this shift in consensus is the ongoing strength evident in the U.S. economy. In addition, there was also increasing concern last month over the inflationary impact of rising oil prices. Buoyant demand and ongoing supply constraints saw the global oil price jump 8.6% in September.
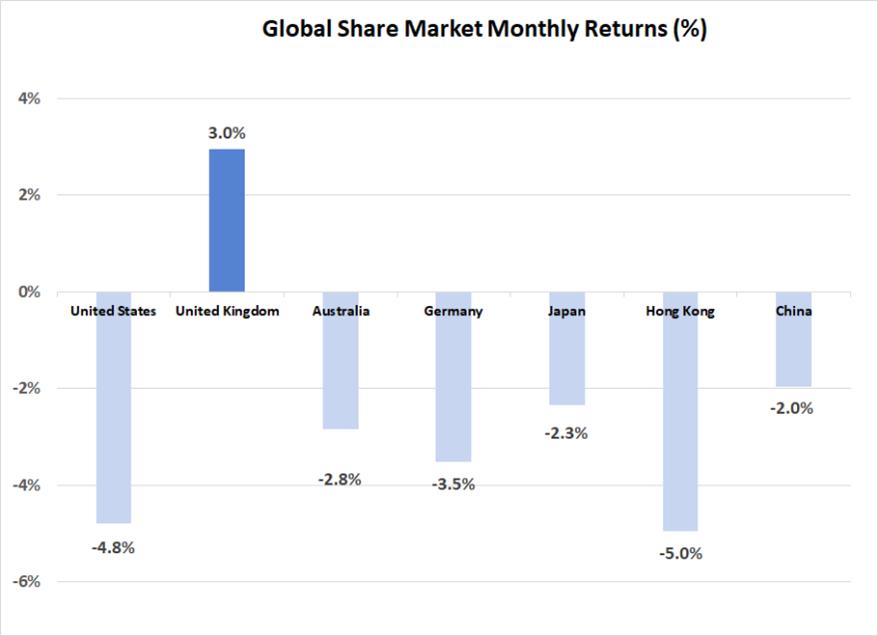
Global markets were led lower by the United States (down 4.8%), where the bond yield increase was most significant. In addition, a reversal of some recent strength in the Information Technology sector (which dropped 6.6%) weighed more heavily on the U.S., given its dominance in the sector mix there. Other developed markets were generally lower by between 2% and 4%, although the United Kingdom was an exception, posting a 3.0% increase. The higher oil price and some weakness in the value of the Pound assisted the U.K. market last month.
Emerging markets performed slightly better than developed markets, however the MSCI Emerging Markets Index was still negative 2.3% in $A terms over September. The ongoing lack of any significant economic policy stimulus continued to weigh on the Chinese share market; however, there were gains in India (up 2.0%) and Brazil (up 1.3%). Oil exporting nations were also positive, boosted by the stronger crude oil price.
As was the case in August, higher bond yields detracted from the appeal of property and infrastructure investments. Global infrastructure stocks dropped by 4.1%, with losses even higher on listed property markets. The Australian REIT sector was hit particularly hard, with an 8.7% decline, as the largest constituent, Goodman Group (down 8.2%), reversed its gains from the previous month.
Australian Equities
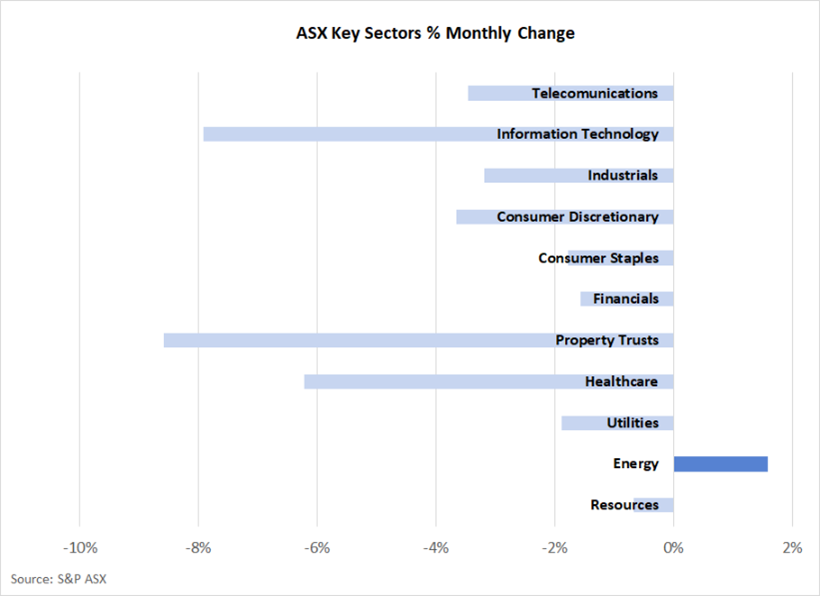
The Australian market slightly outperformed the global average over September, with the S&P ASX 200 Index falling by 2.8%. In annual terms, returns remain positive at 13.5%. Energy stood out as the only sector finishing in positive territory, boosted by higher crude oil prices. Consistent with the pattern overseas, “growth” sectors such as Information Technology and Healthcare recorded the largest losses, alongside property trusts.
Resource stocks were amongst the better performers last month. In addition to higher oil prices, iron ore prices also strengthened slightly over September. The iron ore price remains 21.9% above the level of one year earlier, despite the weakness in the Chinese economy and Chinese construction sector.
Fixed Interest & Currencies
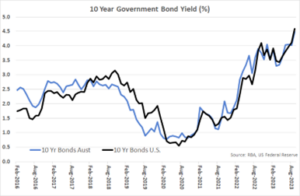
Both the Australian and United States central banks kept cash interest rates unchanged last month. However, despite the stability at the front end of the yield curve, there was once again significant increases in longer term bond yields. In the United States, the 10-year Treasury bond yield jumped from 4.12% to 4.59%. Similarly, in Australia, the 10-year yield rose from 4.02% to 4.48%. These yield increases created capital losses in fixed interest asset classes.
Stronger economic data, and increased inflationary pressures from oil prices, have been two contributors to the higher bond yields. In addition, there has been increased focus on the size of the United States government debt position and the ongoing need to issue more bonds – with the bond supply addition potentially causing further bond price weakness (pushing yields higher). This could see a “vicious circle” develop whereby higher interest rates lead to more government interest expenditure, creating a need for more bond issuance and higher yields.
With the sharp increase in U.S. bond yields, the rally in the value of the $US continued over September. This strength in the $US saw a corresponding fall in the $A, which dropped slightly from U.S. 64.9 cents to U.S. 64.6 cents. The $A did, however, appreciate against the Japanese Yen (up 1.8%) and the Euro (up 2.8%).
Outlook and Portfolio Positioning
Whilst dramatic movements on equity markets often dominate the finance headlines, the upward shift in bond yields recorded over the past two months has been somewhat remarkable and unexpected. Between the first weeks of August and October, the U.S. 10 year treasury bond yield has jumped from 4.0% to 4.8%. In the context of long term bond yields, that is a significant change and has ramifications for the pricing of all financial assets.
Prior to this hike in yields, there appeared to be a growing consensus that the fight against inflation was being won, which would allow for a period of stability in monetary policy and interest rate settings. However, a jump in the oil price, some stronger than expected U.S. economic data and a re-focussing by markets on the deficit and future funding requirements of the U.S. government (possibly triggered by the Fitch credit rating downgrade), has radically changed the course of bond markets.
The reaction of share markets to the sharp escalation in bond yields over the past two months has been both logical and quite modest relative to the size of the increase in yields. All else being equal, higher bond yields should result in equity market decline, as share prices need to adjust downwards in order for future equity market returns to provide the same risk premium over bonds (the “relative value” effect). This response is most “automatic” for those equities where stable yields are the primary source of return, which explains why property and infrastructure have fared so poorly over recent weeks. However, the broader market should, and has been, impacted by the rise in yields, with those companies with a high dependence on borrowings impacted by both the “relative value” effect as well as a direct fall in expected net earnings due to higher borrowing costs.
Often, an increase in bond yields occurs due to an improvement in the economic outlook that creates an anticipation that tighter monetary policy will be forthcoming. Subsequent improvements in earnings forecasts may offset some or all of the negative effect of higher bond yields on equity valuations. However, improved earnings forecasts have not been a feature of the past two months, hence the logical downward movement on share markets. For Australia, whilst the jump in yields has been slightly less significant (the 10-year yield has increased from 4.0% to 4.6% in the two months to early October), the change has created an interesting dichotomy, whereby our yield curve has steepened and become more “normal”; whereas the U.S. yield curve remains negative courtesy of their higher cash interest rate.
Although the rise in longer term bond yields has created some shorter term pain for investors, the positive aspect of the shift for investors is that returns for risk free assets have fundamentally increased over the past two months. For Australian investors, the fact that yields here have been “led” higher by global factors, increases the attractiveness of local longer term yields. There is now a material premium on offer over cash, which is perhaps not justified by fundamentals. Australia’s economy has weakened over the course of 2023 and has contracted on a per person basis. This would normally be associated with an increased probability of future softening in policy and interest rates. As such, the recent jump in longer term yields may present an opportunity to “lock-in” a return premium that could play a valuable role in portfolios if economic weakness continues.
Important Information
The following indexes are used to report asset class performance: ASX S&P 200 Index, MSCI World Index ex Australia net AUD TR (composite of 50% hedged and 50% unhedged), FTSE EPRA/NAREIT Developed REITs Index Net TRI AUD Hedged, Bloomberg AusBond Composite 0 Yr Index, Barclays Global Aggregate ($A Hedged), Bloomberg AusBond Bank Bill Index, S&P ASX 300 A-REIT (Sector) TR Index AUD, S&P Global Infrastructure NR Index (AUD Hedged), CSI China Securities 300 TR in CN, Deutsche Borse DAX 30 Performance TR in EU. Hang Seng TR in HK, MSCI United Kingdom TR, Nikkei 225 in JP, S&P 500 TR in US.
General Advice Disclaimer
This document has been prepared by Plain English Economics Pty Ltd, trading as “Brad Matthews Investment Strategies” (BMIS). Plain English Economics Pty Ltd is a Corporate Authorised Representative of First Point Wealth Management P/L (AFSL 483004). The document is intended for the use of financial adviser clients of BMIS and their staff only. Any advice provided is of a general nature and does not take into account personal circumstances. Any decision to invest in products mentioned in this document should only be made after reviewing the relevant Product Disclosure Statements. Past performance is not a reliable indicator of future performance.