
– November Market Snapshot –
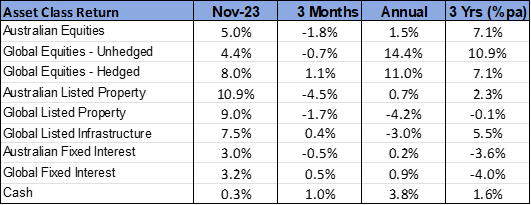
- Following 3 months of increase, bond yields fell sharply over November, in response to a lowering of inflationary pressure.
- The fall in bond yields triggered a significant rally on equity markets.
- Being interest rate sensitive, listed property was the best performing asset class last month.
International Equities
Financial markets were the mirror image of the previous 3-months, with a large proportion of the negative returns on bond and equity markets recorded from August to October being reversed in November. Central to the turnaround in sentiment was an improvement in the outlook for inflation, with global data continuing to highlight a downward trajectory in price growth. Data was released in the United States showing the annual rate of inflation had fallen to 3.2%. The favourable view on inflation was further reinforced by global oil prices, which fell by 6.3% last month to be 9.2% lower for the quarter. Despite the ongoing conflict in the Middle East and cuts to supply by OPEC nations, oil demand has been insufficient to support prices at the elevated levels reached mid-year.
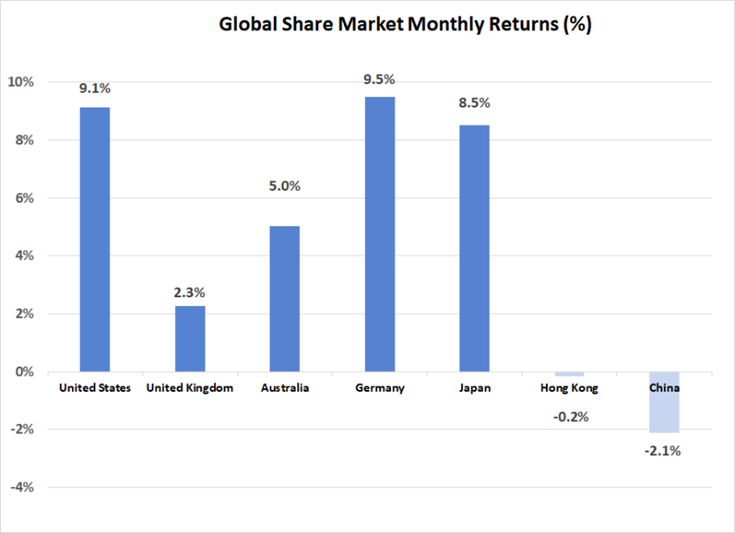
Global equities were led higher by the U.S. market, where the S&P500 Index jumped 9.1%. Growth styled equities performed exceptionally well in response to the lower bond yields, with the Information Technology sector contributing strongly to the U.S. market outperformance. The United Kingdom underperformed given its more “value” style orientation and higher exposure to weaker energy prices.
Although finishing the month well into positive territory, emerging markets underperformed developed markets, with the gain in the MSCI Emerging Markets Index (unhedged) being 3.1%. Once again, China (down 2.1%) detracted from returns, despite some evidence that consumer spending within the Chinese economy may be starting to improve. Outside of China, results from other emerging markets were more impressive, with India (up 6.9%) and South Korea (up 11.0%) offsetting the weakness in China.
After being sold down heavily in the preceding quarter in response to higher bond yields, listed property and infrastructure responded to lower yields in November with strong price increases. Global infrastructure finished 7.5% higher, with Australian and global property rising by 10.9% and 9.0% respectively. Despite the November rally, the annual performance of global property and infrastructure still significantly lags that of equities more broadly and remains in negative territory.
Australian Equities
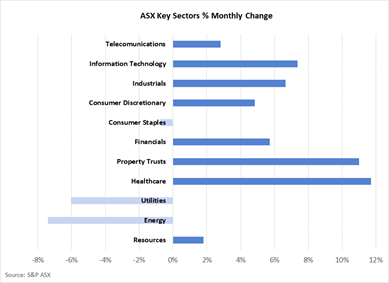
There was significant disparity across sectors within the Australian equity market last month, with the S&P ASX 200 Index rise of 5.0% underperforming the global average. Weaker oil and gas prices impacted negatively on the energy sector. Returns were also negative in the Utilities sector, with the expected failure of the Origin Energy takeover bid being a major contributor to this weakness. In addition, consumer staple stocks moved against the general trend, with increasing scrutiny of pricing policies and margins likely to result from the recently announced Commonwealth Senate Enquiry into supermarkets.
Consistent with the global pattern, growth sectors performed better than average, with healthcare, in particular, reversing some recent underperformance with a gain of 11.7%. Resource stocks, however, were an underperformer. Despite ongoing strength in the iron ore price, signs of weaker volumes and a strengthening Australian dollar (which reduces the $A price received by exporters) softened the support for mining stocks last month.
Fixed Interest & Currencies
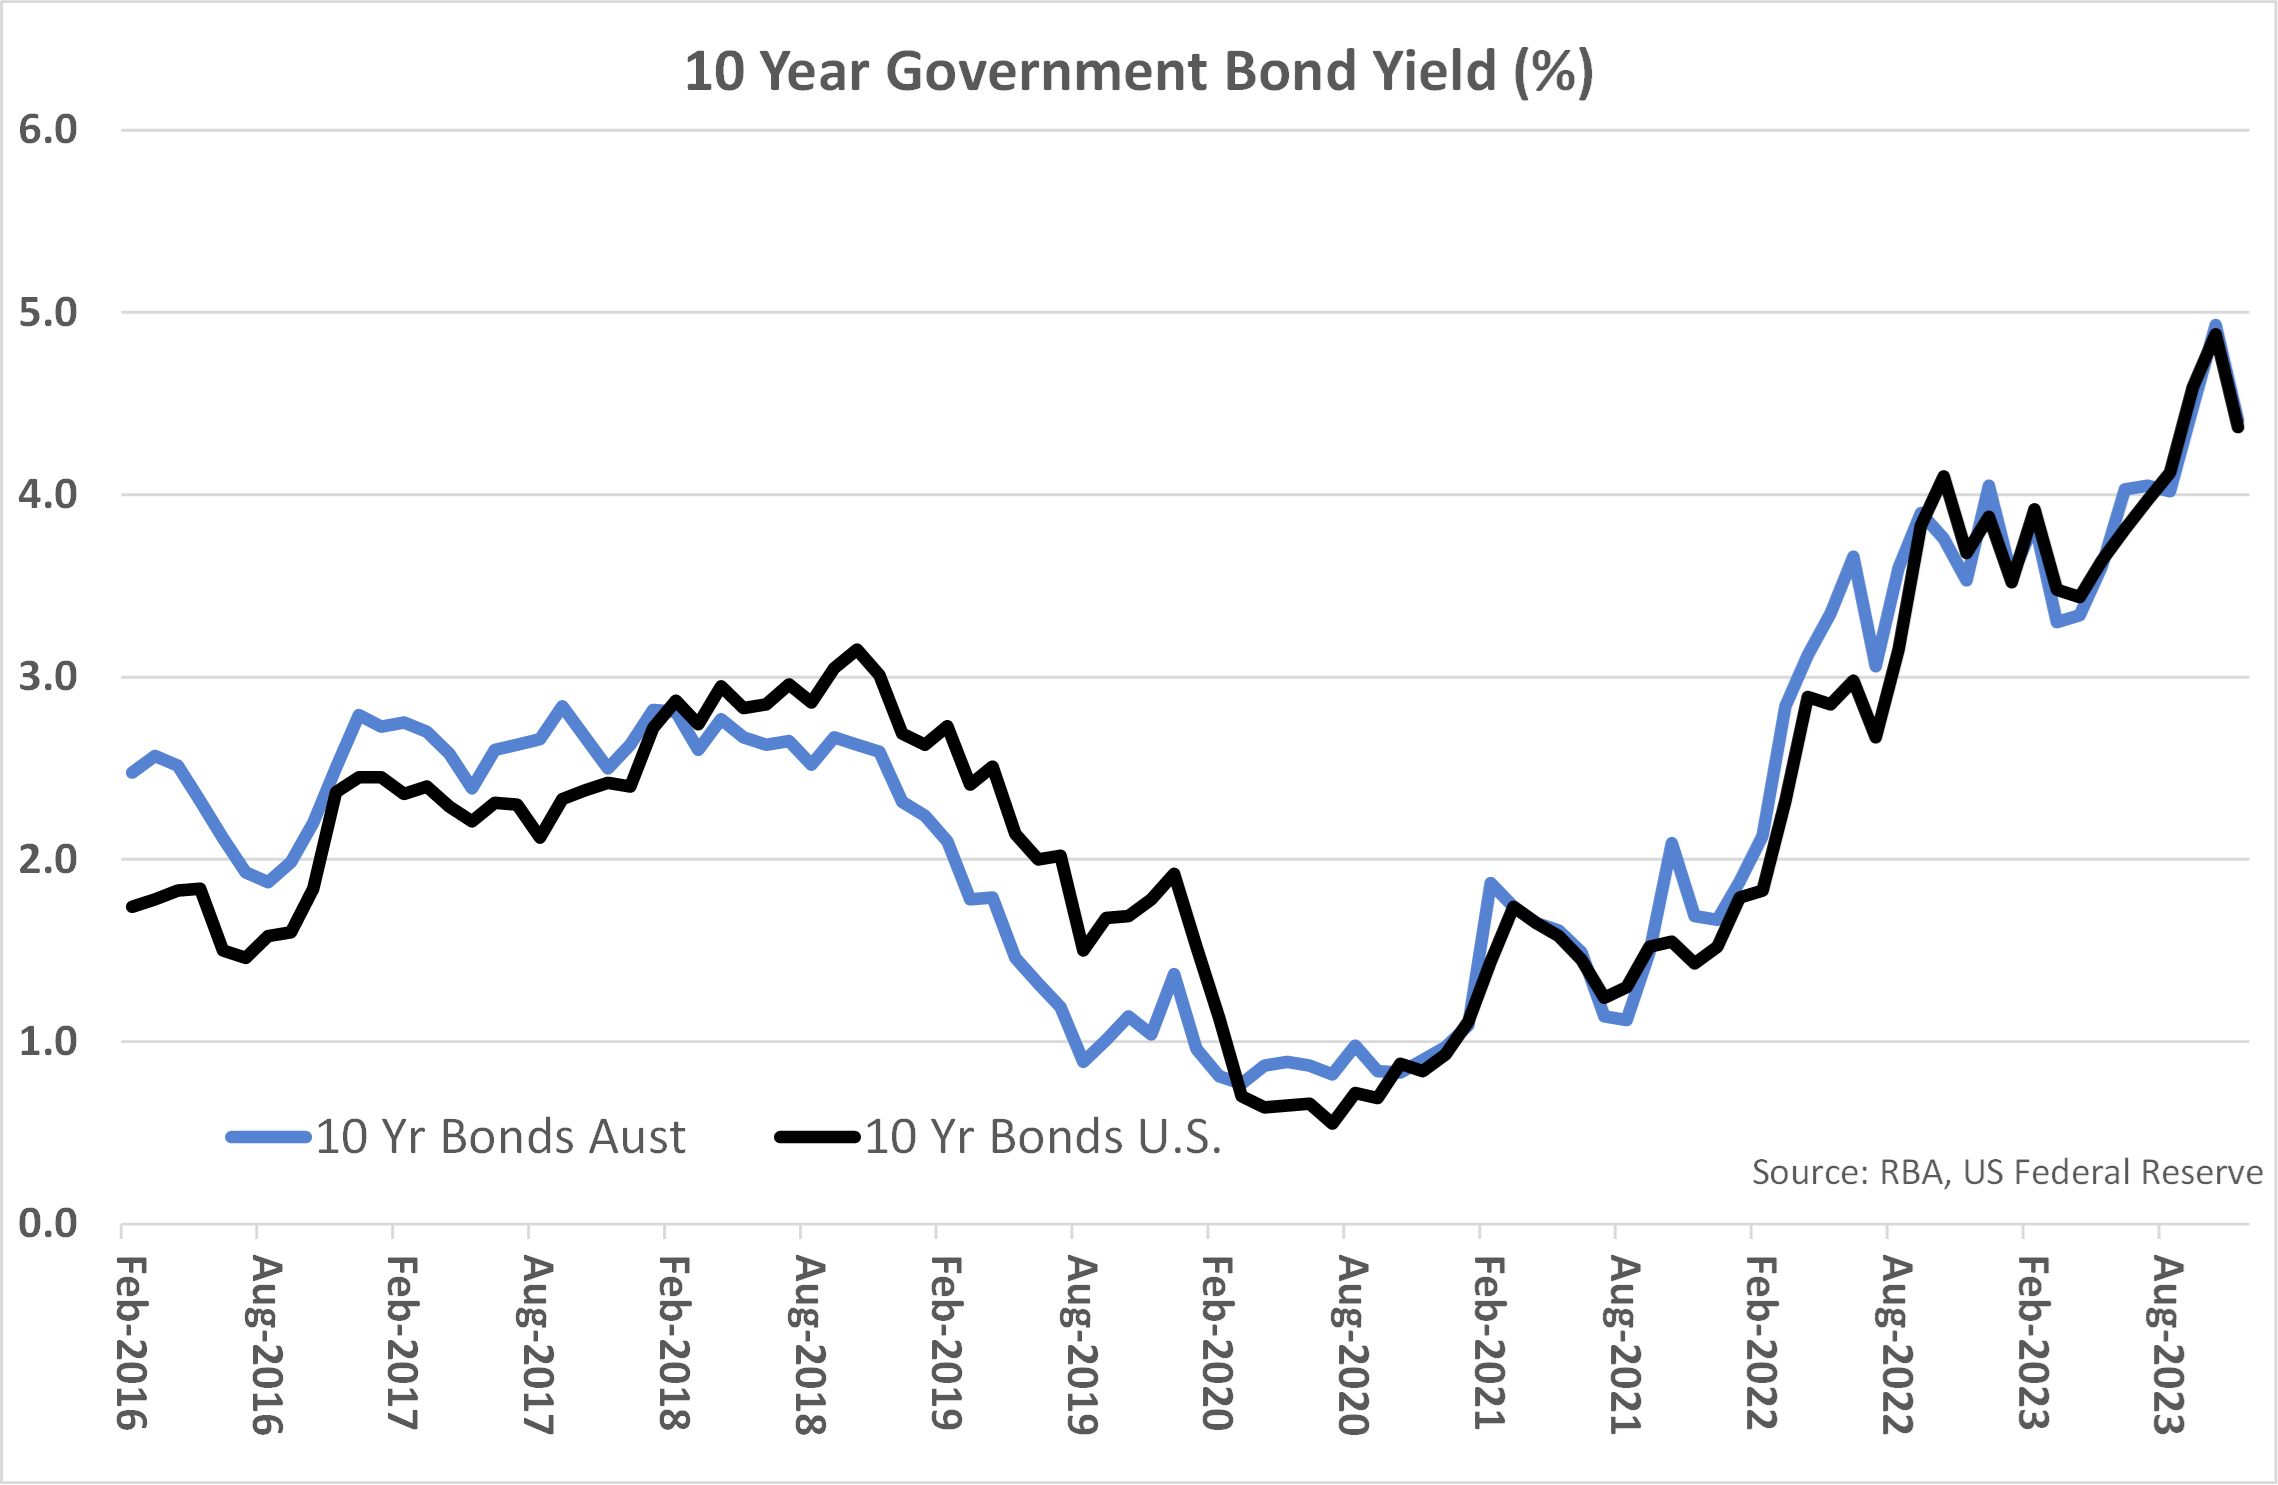
As has been the case over recent months, interest rate movements at the longer end of the yield curve were most significant. Ten year government bond yields in both Australia and the United States fell by approximately 0.5% to 4.4%. This decline in yields follows a 0.9% increase in the previous two months. Improvements in the outlook for global inflation have changed the tone of bond markets, with consensus now firmly behind the view that additional cash rate increases will not be required. The Australian Reserve Bank has been one of the few central banks to raise rates in recent months, with Australia’s cash interest rate being lifted to by 0.25% to 4.35% at the start of November – before being held steady at the start of December.
Also moving against the general trend of recent months was the Australian dollar, which gained U.S. 3.0 cents against a weaker $US to close the month at U.S. 66.5 cents. The rise in cash interest rates early in November was supportive for the $A, which also appreciated against the Yen (up 2.6%) and the Euro (up 1.2%).
Outlook and Portfolio Positioning
The speed and magnitude of adjustment on financial markets over November was remarkable given the lack of any major surprises in economic data or policy announcement. The dramatic response on bond markets to some mildly better than expected news on inflation perhaps served to highlight the overreaction in the previous two months when 10-year bond yields jumped nearly 1%. Certainly, the unwinding of the September quarter rise in the oil price is a positive development for inflation; however, oil prices are inherently volatile and can only explain a small part of what has been witnessed on bond markets over recent months.
Although the response on equity markets has been somewhat more measured than bond markets, recent market movements have seen disparities within the equities universe widen further. The performance gap between the United States Technology sector and the remainder of the market has continued to expand. In the 12 months to the end of November, the U.S. Technology sector has rallied some 45.1%, which dwarfs the increase in the overall U.S. S&P 500 Index of 13.8%. Over the same period, the European market is 8.8% higher and the Australian market a meagre 1.5% higher. The valuation gap between large and small companies has also continued to widen, with global smaller companies returning 3.3% over the past year, with the Australian counterparts actually falling in value by 3.2%.
A higher rate of earnings growth does justify the Information Technology sector trading at elevated valuations when compared with the broader market. However, recent price increases have stretched these valuation differences. Based on one year forward earnings expectations, the Nasdaq 100 Index (consisting of 100 non-financial U.S. domiciled companies with a strong technology and communications focus) is currently trading at a Price to Earnings ratio of 22 times. The comparable ratio for the top 500 U.S. companies held on an equally weight basis is only 14 times, which is similar to the valuation of the broader Australian and European markets.
For the more expensive U.S. technology sector, which accounts for nearly 30% of the U.S. market, valuations appear finely poised. If global economic conditions do continue to soften, companies such as Microsoft and Apple will not be immune from earnings impact. Should earnings be revised downwards, the currently hefty valuations may be difficult to sustain. Those parts of the equity market that haven’t enjoyed the same success over recent quarters may then prove to be more defensive, simply on the basis that they don’t have as far to fall.
With the fight against inflation seemingly being won, equity market direction may now become less influenced by macro factors such as interest rates, which have dominated share market direction since the COVID crisis. Becoming more important is likely to be company earnings and the response of earnings to a weaker economy. Undoubtably, earnings impact will vary from company to company and with valuations across companies and sectors already highly disparate, the period ahead could be one which is ripe for active stock selection. Holding the largest and most expensive companies purely on the basis of their index weight and past performance could become an increasingly fraught strategy.
Important Information
The following indexes are used to report asset class performance: ASX S&P 200 Index, MSCI World Index ex Australia net AUD TR, MSCI World ex Australia NR Hdg AUD, FTSE EPRA/NAREIT Developed REITs Index Net TRI AUD Hedged, Bloomberg AusBond Composite 0 Yr Index, Barclays Global Aggregate ($A Hedged), Bloomberg AusBond Bank Bill Index, S&P ASX 300 A-REIT (Sector) TR Index AUD, S&P Global Infrastructure NR Index (AUD Hedged), CSI China Securities 300 TR in CN, Deutsche Borse DAX 30 Performance TR in EU. Hang Seng TR in HKD, MSCI United Kingdom TR in GBP, Nikkei 225 in JPY, S&P 500 TR in USD.
General Advice Disclaimer
This document has been prepared by Plain English Economics Pty Ltd, trading as “Brad Matthews Investment Strategies” (BMIS). Plain English Economics Pty Ltd is a Corporate Authorised Representative of First Point Wealth Management P/L (AFSL 483004). The document is intended for the use of financial adviser clients of BMIS and their staff only. Any advice provided is of a general nature and does not take into account personal circumstances. Any decision to invest in products mentioned in this document should only be made after reviewing the relevant Product Disclosure Statements. Past performance is not a reliable indicator of future performance.