

– February Market Snapshot –
- The rally in global equities continued over February, with positive earnings results in the U.S. technology sector being the main catalyst for continued price growth.
- Bond yields inched higher as markets pushed back the expected timing of any interest rate cuts.
International Equities
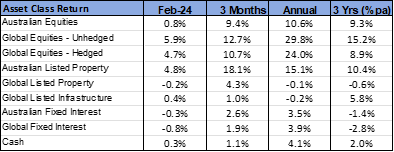
Global equities were once again led higher by the U.S. market, where the S&P 500 Index reached a new record high during February when it gained 5.3%. A favourable profit reporting season buoyed investor confidence, which was particularly the case in the technology sector where share valuations advanced 6.3%. Over the past year, the U.S. technology sector has rallied 59%, compared to the 30% gain in the S&P 500 Index overall. Further, highlighting the dominant role the large technology stocks have played in the U.S. market, if each of the 500 stocks in the S&P 500 Index were held on an equally weighted basis (rather than weighted to market capitalisation size), then the gain in the S&P 500 Index would have been just 13%.
Outside of the United States, share markets were generally strong with Germany (up 4.9%) and Japan (up 8.6%) posting impressive results. In a turnaround from recent months, there was a sharp bounce higher in the Chinese market, which gained 9.4%. Support for the Chinese market may have come from anticipation of new initiatives expected to be announced at the National People’s Congress annual meeting due to be held in early March. The strong result in China contributed to a 6.4% jump in the MSCI Emerging Market Index, which finished marginally ahead of the developed market index over the month.
Although the large U.S. technology stocks have been dominant in terms of return contribution, there has also been some recovery in smaller global stocks over recent months. During the past quarter, the MSCI World Small Cap Index (unhedged) has advanced 12.3%. This is broadly in line with the larger company global average and follows a period over much of 2023 when smaller companies significantly underperformed their larger counterparts.
As was the case in January, a small lift in longer term interest rates detracted support for global property and infrastructure over February. In fact, global listed property finished the month in negative territory at -0.2%, with listed infrastructure only slightly positive at 0.4%. Returns from both sectors are now flat on an annual basis, which is a significant variation from global equities which are 24% higher for the year. The performance of Australian listed property has been more positive, with the local listed property sector advancing 4.8% last month and by 15.1% over the past year. Goodman Group, which makes up more than 30% of the local listed property index, has been a significant contributor in rallying 16.8% last month and 52.6% for the year.
Australian Equities
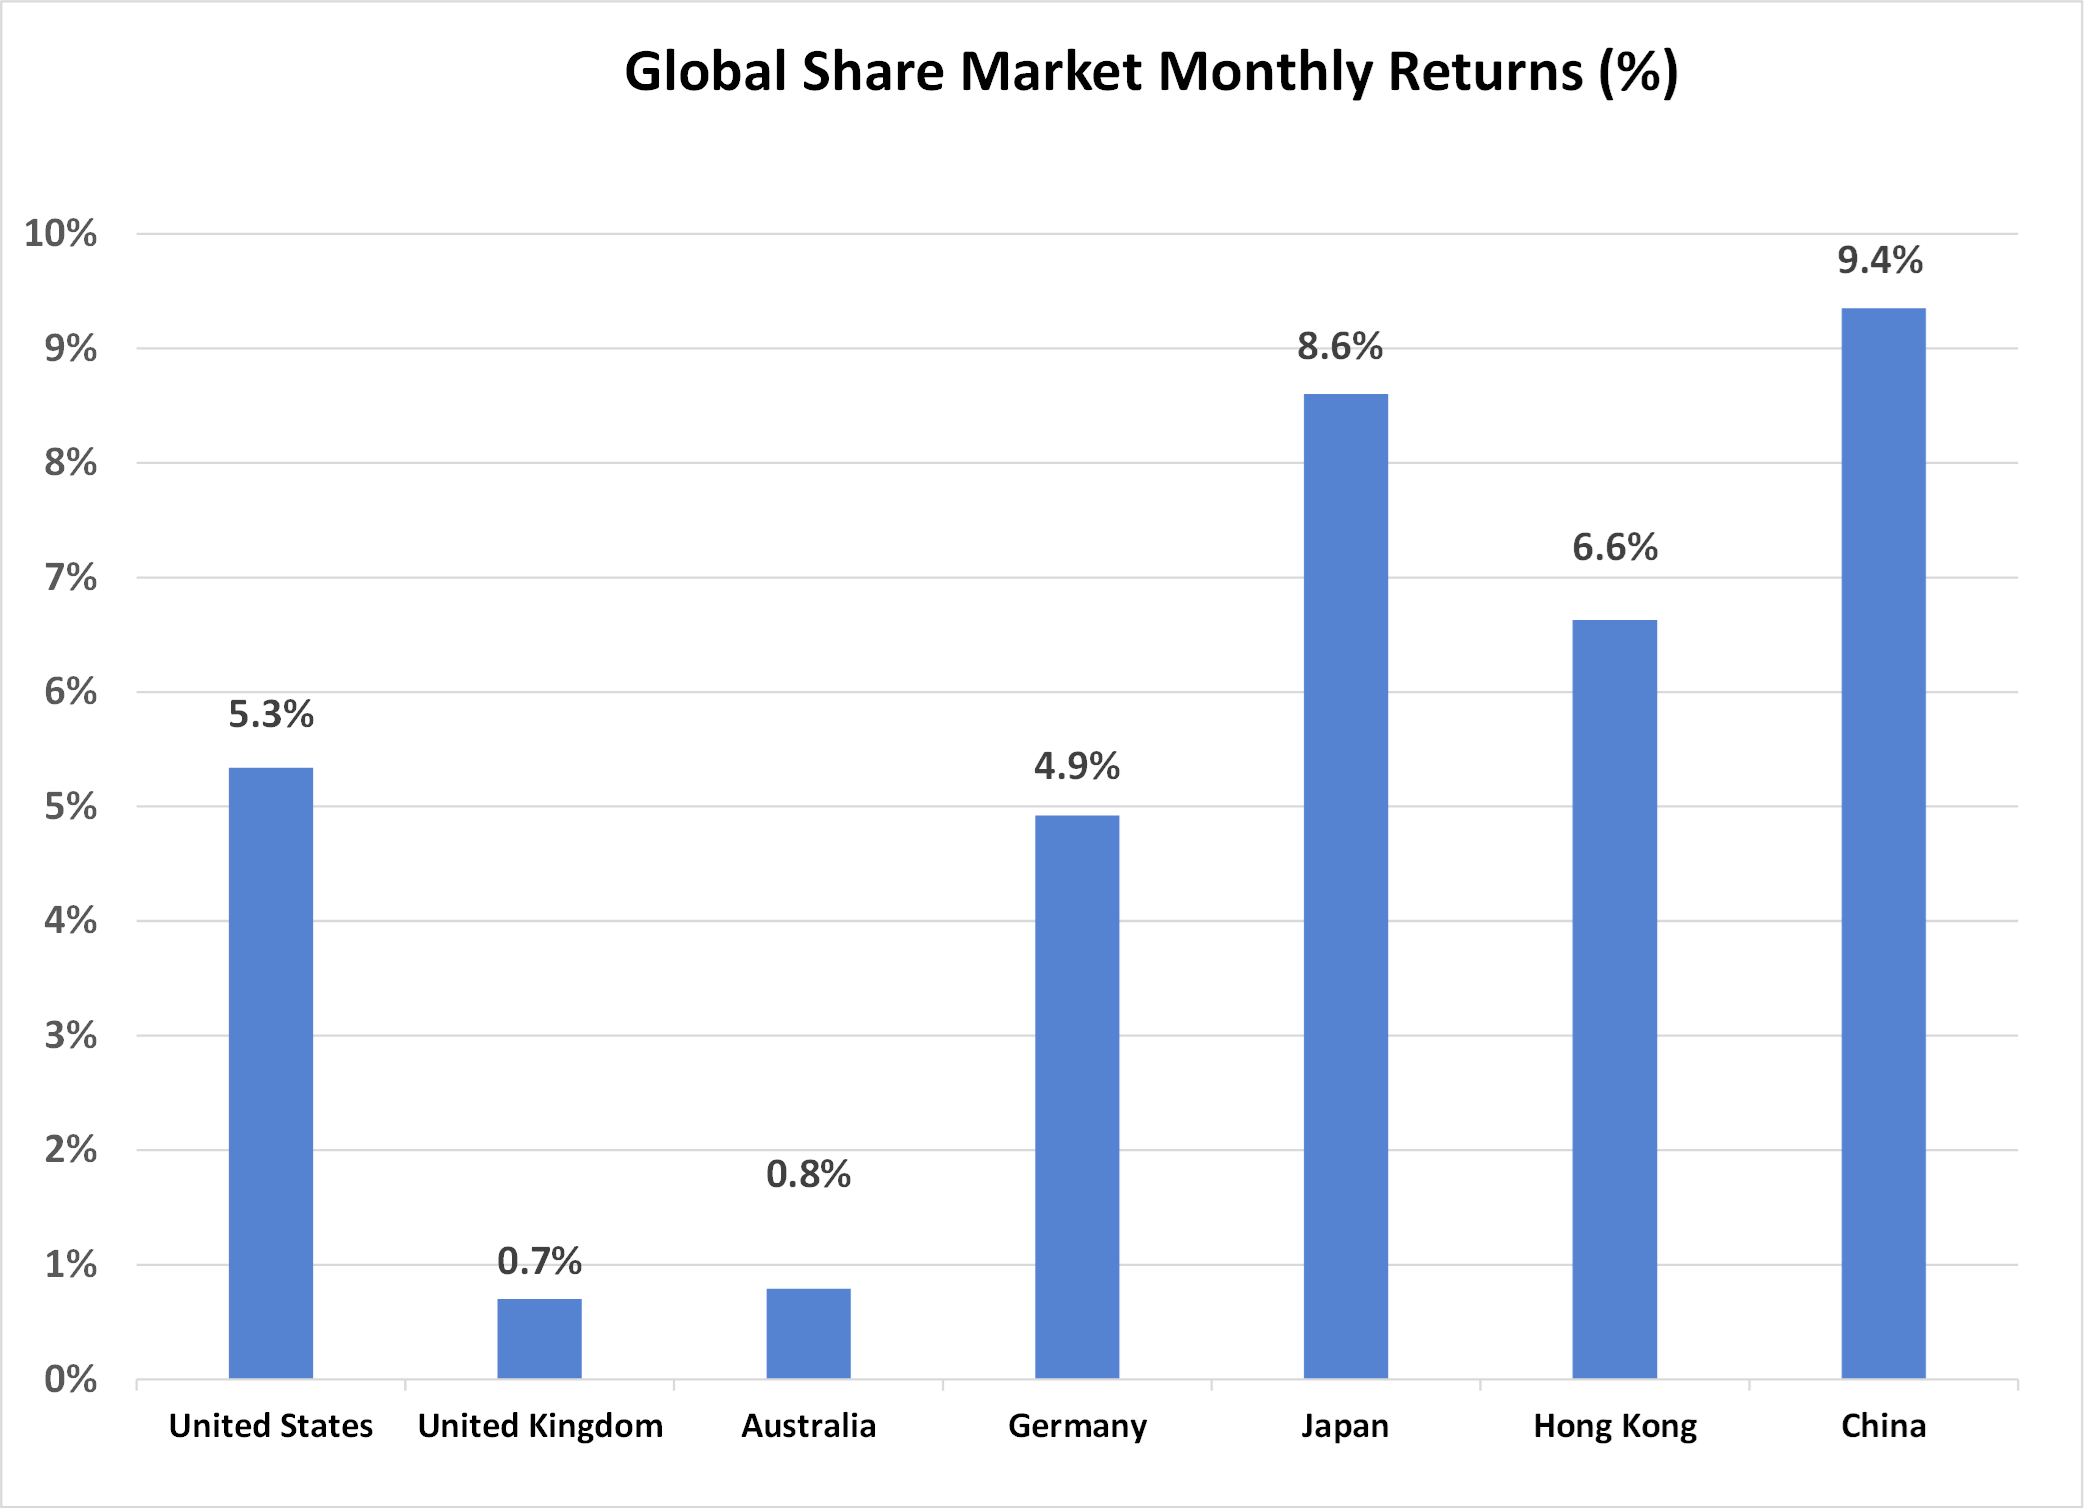
The Australian share market underperformed the global average, with the S&P ASX 200 Index rising by just 0.8% last month. The local market was weighed down by the resources and energy sectors, which both declined by 6.0%. Of significance was a 7.9% decline in the iron ore price, which follows a 6.7% fall in January. The weaker iron ore price saw falls in the price of BHP (down 7.1%) and Rio Tinto (down 6.9%). Large energy stocks were also weaker, despite a 3.3% rise in the global oil price.
Consistent with the broader global trend, the Information Technology sector was the best performed on the Australian market last month with a surge of 19.5%. A favourable response to the profit announcement from Wisetech (a logistics software provider), was a significant contributor to the sector’s gain, with a price rally of 29.4%.
The profit reporting season for the period ending December 2023 generated mixed results. There were slightly more companies missing than exceeding earnings expectations. The results also highlighted the modest earnings growth expectations of many companies for the period ahead.
Fixed Interest & Currencies
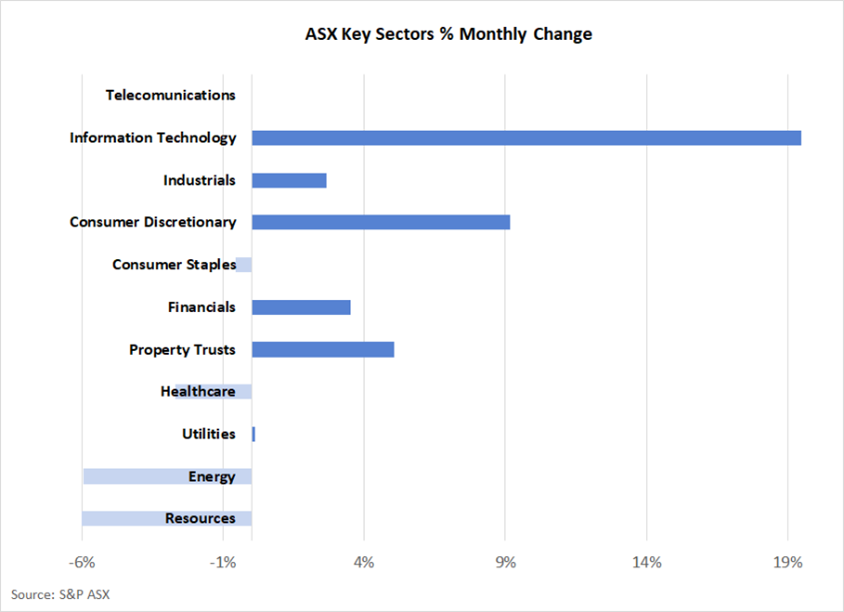
With no change in cash interest rates across major economies over February, longer term yields drifted slightly higher. A combination of statements from central banks, and marginally higher than expected U.S. inflation, led money markets to push back expectations around the timing and magnitude of interest rate cuts. Australian 10-year government bond yields increased from 4.0% to 4.1%, with the U.S. equivalent rising from 4.0% to 4.25%.
National Accounts data released for the Australian economy showed economic growth to be a modest 0.2% in the December quarter and 1.5% over the past year. With growth continuing to be negative on a per capita basis, the rationale for the Australian Reserve Bank to cut interest rates earlier than the U.S. seems to be strengthening.
For the second consecutive month, the $A depreciated over February, dropping from U.S. 65.7 cents to 65.2 cents. Weaker iron ore prices and a stronger $US contributed to the lower the lower $A. The $A was also 1.0% weaker against the Euro but moved 0.6% higher against the Japanese Yen.
Outlook and Portfolio Positioning
One of the big surprises of 2023 was the resiliency of the iron ore price. Despite the collapse of the Chinese property sector and the decline in price of most other commodities, the iron price held firm. Explanations for the iron ore price defying gravity were scarce, although it did appear that Chinese steel mills remained highly active with production associated with industries such as ships and motor vehicles operating at very healthy levels.
The new calendar year has coincided with a sharp change in direction for iron ore. From a price of $US 147 per metric tonne at the end of 2023, iron ore is currently trading at $US 109, a fall of 26%. Although still not cheap when compared with past cycles, the change in direction of the price trend is notable and has potentially significant implications for the Australian economy and share market. Such is the significance of iron ore as a share of Australia’s export receipts, that a fall in its price acts as a contractionary force on the economy. Company earnings, government tax revenues (and therefore government expenditure) and household income from dividends are all negatively impacted by a lower iron ore price. The fact that the fall in the iron ore price follows sharp declines in Australia’s revenue from energy and base metal commodities last year magnifies the importance of the latest change.
Prior to the recent correction in iron ore, the Australian economy was already subdued. The minor 0.2% expansion in Gross Domestic Product recorded for the December quarter continued the pattern of negative economic growth on a per person basis. This lack of economic growth, combined with very constrained household disposable income and poor labour productivity, will make it a difficult environment for domestically facing companies to grow earnings – a fact that was apparent in many recent company earnings outlook statements. In addition, the state of the domestic economy does raise the prospect that the Reserve Bank will be in a position to cut interest rates earlier, rather than later. Should Australian cash interest rates decline prior to any fall in U.S. cash rates, then it could be a negative environment for the Australian dollar as foreign investors switch to higher yielding currencies.
This possibility of a more challenging environment ahead for the Australian economy, company earnings and the $A, highlights the need for ongoing international diversification within investment portfolios. The growth prospects for the U.S. economy and several emerging economies appear bright in comparison. Holding a healthy proportion of global exposure on an unhedged currency basis (and therefore benefiting from any decline in the $A) may also prove to be a valuable source of diversification should domestic conditions deteriorate in the period ahead.
Important Information
The following indexes are used to report asset class performance: ASX S&P 200 Index, MSCI World Index ex Australia net AUD TR, MSCI World ex Australia NR Hdg AUD, FTSE EPRA/NAREIT Developed REITs Index Net TRI AUD Hedged, Bloomberg AusBond Composite 0 Yr Index, Barclays Global Aggregate ($A Hedged), Bloomberg AusBond Bank Bill Index, S&P ASX 300 A-REIT (Sector) TR Index AUD, S&P Global Infrastructure NR Index (AUD Hedged), CSI China Securities 300 TR in CN, Deutsche Borse DAX 30 Performance TR in EU. Hang Seng TR in HKD, MSCI United Kingdom TR in GBP, Nikkei 225 in JPY, S&P 500 TR in USD.
General Advice Disclaimer
Any advice contained in this document is of a general nature only and does not take in to account the objectives, financial situation or needs of any particular person. Any decision to invest in products mentioned in this document should only be made after reviewing the relevant Product Disclosure Statements. Past performance is not a reliable indicator of future performance. Varria Pty Ltd is an authorised representative of Charter Financial Planning ABN 35 002 976 294 AFSL number 234665