

– April Market Snapshot –
- Share markets ended a 5-month winning streak and lost ground over April.
- Higher than expected inflation in the U.S. was the primary driver of the equity market decline.
- Inflation also triggered higher bond yields, as markets reassessed expected interest rate cuts.
International Equities
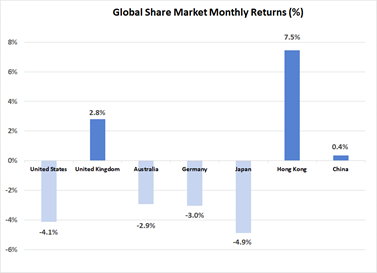
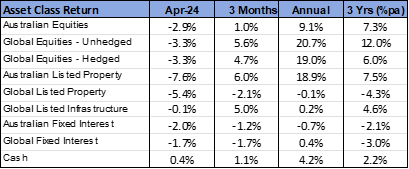
Following a particularly strong rally in the preceding 5 months, global equity markets declined by an average of 3.3% over April. The global market was led lower by the United States, where higher than expected inflation created the conclusion that interest rate cuts would not be forthcoming as early as previously anticipated. Growth and cyclical stocks were sold off more heavily in the U.S., with some of the more defensive sectors, such as Utilities and Consumer Staples, defying the broader trend and posting small increases. In contrast, the technology sector under performed the broader market average for the second consecutive month, despite further earnings results that reinforced the ongoing success of some of the larger technology companies.
Outside of the U.S., losses were less significant with more moderate declines recorded across Europe. With the European economy weaker, there is less upward pressure being placed on inflation, which creates greater scope for imminent interest rate declines. The United Kingdom was a standout in posting a gain of 2.8%, with strong support for energy stocks being a key contributor. Although the oil price was slightly weaker over the month, it has held onto most of the gains from earlier in the year to be 8.0% higher for the quarter.
For the third consecutive month, the Chinese market outperformed the global average in posting a small gain of 0.4%. Hong Kong was more impressive, with a 7.5% rally indicating that sentiment around the region has improved. The positive result in China allowed the MSCI Emerging Market Index (up 0.9%) to outperform global equities more broadly.
Being more defensively positioned and with earnings positively correlated to inflation, there was some support for infrastructure assets. Global listed infrastructure stocks experienced just a minor 0.1% decline last month. However, being more sensitive to interest rates, global listed property (down 5.4%) recorded more significant declines.
Australian Equities
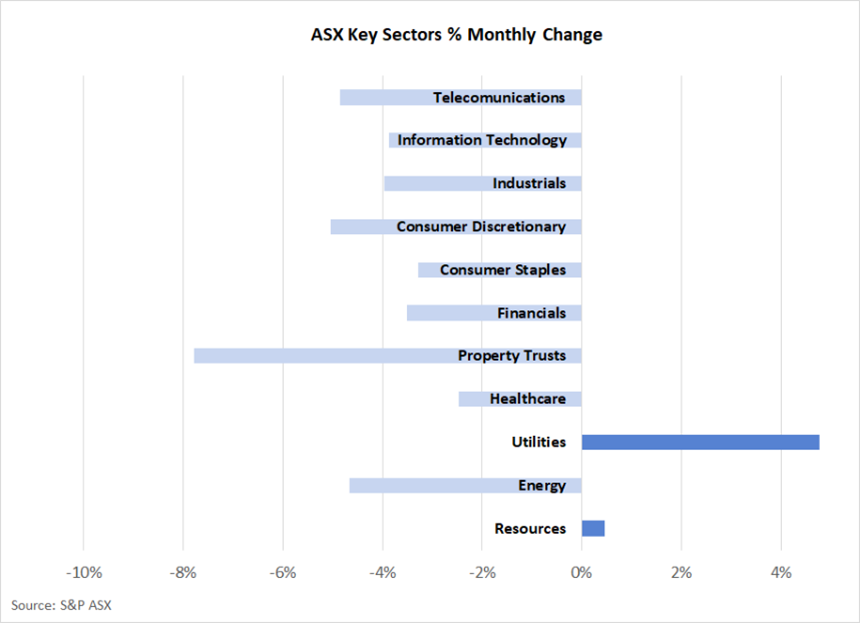
The Australian share market performed marginally better than the global average last month, with the S&P ASX 200 Index falling 2.9%. Supporting the Australian market was a small positive result from the resource sector. Higher base metal prices and a slight lift in the iron ore price (following recent weakness) saw generally strong support for mining companies. Rio Tinto (up 7.2%) and South 32 (up 19.7%) were the largest contributors. The Utilities sector also moved against the broader market trend, with AGL (up 13.4%) being well supported.
Outside of Resources and Utilities, all other sectors were negative over April, with most in the -2% to -4% range. Listed property, however, recorded the largest fall with its 7.6% decline reversing some recent strength. None-the-less, the sector remains 6.0% ahead for the quarter and 18.9% ahead for the past year, with Goodman Group’s 66.3% annual gain being the key contributor.
Fixed Interest & Currencies
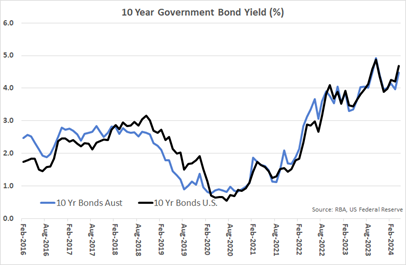
Although cash interest rates and policy settings remained unchanged around the globe last month, there was significant movement across the yield curve. Bond yields adjusted for further changes in expectations over the timing and magnitude of interest rate reductions, as inflation showed further resistance to moving back to target – particularly in the U.S. where spending remains buoyant. Subsequently, higher bond yields created negative returns for fixed interest investors. In the United States, the 10-year Treasury Bond yield jumped from 4.21% to 4.69%. There was a similar increase in Australia, where the 10-year yield moved from 3.96% to 4.47%. Despite these significant increases, yields remain below the peak levels reached in October last year.
Currency markets remained relatively quiet, with the $A steady at U.S. 65.3 cents. There was, however, some strengthening of the $A against a weakening Yen and Euro, with the $A being 3.5% and 1.0% higher respectively.
Outlook and Portfolio Positioning
The focus of share markets has switched relatively quickly over recent weeks from structural drivers of earnings growth (such as artificial intelligence and GLP-1 diabetes / weight loss drugs) to the macro-economic factors of inflation and interest rates. Embedded in the share market rally that took place between October and March was the belief that inflation was heading steadily back to target, and that interest rate cuts were imminent. However, it would now seem that for the period ahead, the shorter-term direction of share markets is going to be heavily dependent on monthly U.S. inflation data. Better than expected results (lower inflation) should result in relief rallies on both equity and bond markets; whereas any further upside surprises in the CPI would be likely to result in a repeat of the pattern that dominated markets in April.
As it is near impossible to accurately predict variances to expectations in monthly CPI data, the shorter-term direction of the share market has become somewhat more random. Longer term, though, there would still appear to be sufficient evidence that the softening evident in demand and labour markets will combine with the ongoing decline in goods inflation to allow CPI measures to return close to target. This evidence was sufficient for the U.S. Federal Reserve Chairman, Mr. Powell, to declare that “I think it’s unlikely that the next policy rate move will be a hike” following the most recent Board meeting.
Locally, the Australian Reserve Bank has been less candid around expectations and have stated that they are “not ruling anything in or out”. Some forecasters have suggested the next change in cash interest rates will be upwards. However, the case for an interest rate increase appears weak given the prevailing trends described below:
- Inflation trajectory is downwards, with the annualised CPI falling every quarter since it peaked at 7.8% in December 2022, to 3.6% at the end of March 2024. More notably, those “discretionary” categories of the CPI most sensitive to monetary policy changes are clearly showing a lower rate of price growth than “non-discretionary” categories.
- Consumer spending has visibly softened, with retail trade volumes in the March quarter being 1.3% below the level one year earlier.
- Labour markets are showing signs of loosening. Vacancies have been steadily declining and aggregate hours worked in March were 1.2% below the peak reached in April 2023 – despite a surge in population growth contributing to a 2.7% increase in the size of the labour force over the same period.
- Wages growth is not indicative of an overheated labour market. The annual growth in the Wage Price Index has been below the underlying rate of inflation each quarter between December 2021 and December 2023.
On balance, therefore, despite some stalling in the inflation decline, existing policy settings remain effective. A long-term return towards inflation targets remains likely without the need for any additional monetary policy tightening. If this the case, and with company profitability remaining buoyant, then the outlook for both bonds and equities is quite favourable. None-the-less, shorter-term gyrations following monthly U.S. inflation data releases are inevitable.
Important Information
The following indexes are used to report asset class performance: ASX S&P 200 Index, MSCI World Index ex Australia net AUD TR, MSCI World ex Australia NR Hdg AUD, FTSE EPRA/NAREIT Developed REITs Index Net TRI AUD Hedged, Bloomberg AusBond Composite 0 Yr Index, Barclays Global Aggregate ($A Hedged), Bloomberg AusBond Bank Bill Index, S&P ASX 300 A-REIT (Sector) TR Index AUD, S&P Global Infrastructure NR Index (AUD Hedged), CSI China Securities 300 TR in CN, Deutsche Borse DAX 30 Performance TR in EU. Hang Seng TR in HKD, MSCI United Kingdom TR in GBP, Nikkei 225 in JPY, S&P 500 TR in USD.
General Advice Disclaimer
Any advice contained in this document is of a general nature only and does not take in to account the objectives, financial situation or needs of any particular person. Any decision to invest in products mentioned in this document should only be made after reviewing the relevant Product Disclosure Statements. Past performance is not a reliable indicator of future performance. Varria Pty Ltd is an authorised representative of Charter Financial Planning ABN 35 002 976 294 AFSL number 234665