
May 2025: Market Summary
- Buoyed by the prospect of moderation in the U.S. tariff program, share markets rallied strongly over May.
- Higher bond yields in Japan and the U.S. failed to dent equity market sentiment.
- Australian bond yields were also higher, despite the RBA cutting cash rates.
Ongoing developments around the U.S. tariff program continued to dominate financial market headlines last month. Of significance was the news that reciprocal tariffs between China and the U.S. will be reduced for a period of 90-days, with trade negotiations to continue over this period. The concessions made for the 90-day period will result in the U.S. lowering its tariffs on Chinese goods from 145% to 30%, with China cutting its tariffs on U.S. products from 125% to 10%. Later in the month, the US Court of International Trade declared that the President’s use of the International Emergency Economic Powers Act to impose tariffs was illegal. However, the newly introduced U.S. tariffs are remaining in place whilst the Court considers an appeal to the ruling. The Court’s ruling does not impact on the tariffs related to automobiles, steel, or aluminium, which were introduced under national security provisions and were separate to the broad tariff program announced in early April. President Trump recently announced that tariffs on steel and aluminium imports will increase from 25% to 50% in an effort to protect the U.S. steel industry.
International Equities
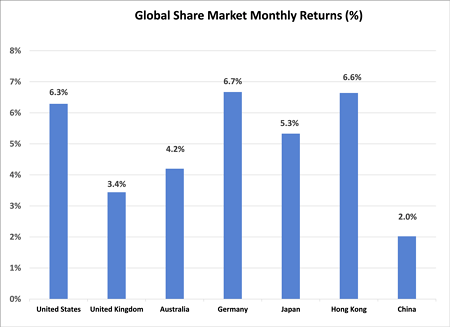
All major global share markets responded positively to the tariff developments, with expectations of lower tariffs being considered positive for global trade, economic growth, and company earnings. The U.S. share market, which had lagged over the previous quarter, returned ahead of the average, with the S&P 500 Index gaining 6.3%. Making a major contribution to the U.S. market rally was the technology sector, with mega caps stocks such as Nvidia (up 24.1%) and Tesla (up 22.8%) leading the market higher. Despite the strength of the rally on the U.S. market over May, valuations remain 3.5% below the peak reached in mid-February.
Outside of the U.S., share markets were also buoyant, with strong support remaining in place for European equities. Japanese shares defied the potential negative impact of rising longer term bond yields, with the Nikkei Index gaining 5.3%. Emerging markets, although underperforming developed markets, also posted solid gains with the MSCI Emerging Markets Index rising 3.7%. The mood on Chinese equity markets (up 2.0%), however, was a little less optimistic than elsewhere, despite the tariff pause.
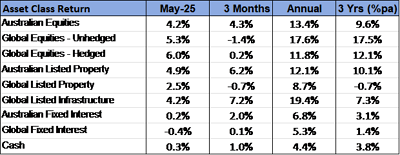
Although there was a return in support for “growth” styled equities over May, valuations for more defensively positioned equities also continued to be bid higher. Global listed infrastructure increased by a further 4.2%, to bring the annual growth to 19.4%. Listed property was also well supported.
Australian Equities
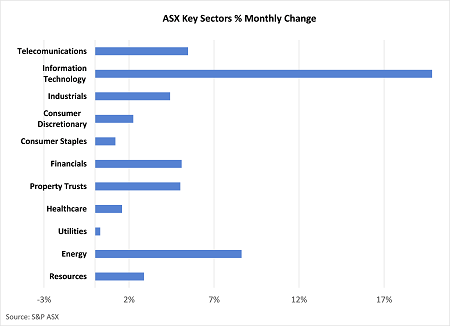
Gains on the Australian share market were significant but fell short of the global average, with the S&P ASX 200 Index rising 4.2% over May. On a quarterly and annual basis, though, the Australian market has performed slightly ahead of the global average (excluding currency effects). Consistent with the global trend, there was strong support across technology stocks, with the sector rising by 19.8%. Life 360 (up 51.9%), Wisetech (up 21.1%) and Technology One (up 36.8%) led the sector higher.
Energy stocks also performed well after having been sold down over recent months. The oil price firmed 4.4% over May, thereby partially reversing some recent decline. Woodside (up 7.3%) also benefited from the Federal Government’s environmental approval of an extension to the company’s North West Shelf project. Also continuing to gain strong support were financial stocks, with CBA’s gain of 5.6% once again being ahead of the sector average and reaching new record highs.
Fixed Interest & Currencies
Australia’s cash interest rate was reduced from 4.10% to 3.85% following the Reserve Bank’s May Board meeting. The lower rate follows a reversion in Australia’s inflation back towards the RBA’s long term 2% to 3% target.
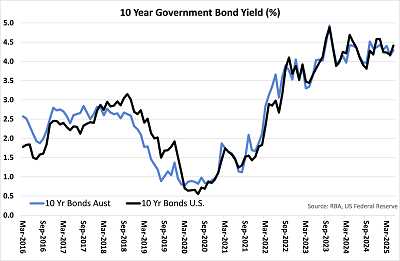
Longer term yields, however, moved higher over the month. Concern over the outlook for the U.S. Government budget was heightened following the decision of the US House of Representatives to pass a new fiscal package of tax cuts and expenditure that is expected to add at least $US 3 trillion to the budget deficit over the next decade. A higher deficit results in more Treasury bonds being issued, which will increase yields – all else being equal. Last month, the U.S. 10-year Treasury bond yield jumped 0.24% to 4.41%. Australian yields appeared to be dragged higher by the U.S. movements, with 10-year government bond yields here rising from 4.15% to 4.29%.
Currency markets were relatively stable over May, with the recent decline in the $US stabilising. The $A finished the month U.S. 0.2 cents higher at U.S. 64.4 cents. There was also a slight appreciation in the $A against the Yen and the Euro of 1.2% and 0.6% respectively.
Outlook and Portfolio Positioning
Divergent moods between equity and bond markets emerged over May. The initial bounce back on share markets in the second half of April was associated with a decline in bond yields, as both markets reversed their immediate response to April’s Liberation Day tariff announcements. However, during May, sentiment on bond markets deteriorated with policy approval given for a further expansion in the U.S. Government’s fiscal deficit. This, combined with sharply increased yields at the longer end of the Japanese yield curve, pushed U.S. Treasury yields higher.
Typically, equity and credit markets would be concerned over any increase in bond yields that was not directly related to an improved economic outlook. A higher risk-free interest rate increases the return investors require from equities to justify holding exposure to the asset class. Although equity investors could take some comfort from the tariff related developments over May, there remains considerable uncertainty over what tariff program will ultimately be implemented. The decision late in the month to double the tariff rate on steel and aluminium imports from 25% to 50% highlights this unpredictability and the ongoing appetite for significant tariff rates to be put in place.
The fact that share market valuations are now more than 5% above the level prevailing just before the Liberation Day announcements should be a cause for caution on share markets. Although large parts of the equity market appear to be trading at reasonable valuations, recent increases in selected parts of the market appear to imply excessive optimism. Tesla, for example, has now increased 94.6% over the past year, after being one of 4 of the mega cap U.S. technology stocks to rally more than 15% in the month of May alone. Domestically, the technology sector has gained 15.2% over the past quarter, with some particularly large gains over May. Selected “defensive” stocks also appear to be trading on abnormally strong momentum, with the CBA and Wesfarmers now achieving Price to Earnings ratios of 31 times and 37 times, despite limited expectations of material earnings growth.
Whereas uncertainty and price growth may have made parts of the equity market less attractive, recent increases in Australian bond yields have improved prospective returns from this asset class. With relatively minimal sovereign related risks or budget deficit concerns, the 4.3% currently on offer from Australian 10-year bonds appears compelling in an environment where the cash interest rate has dropped to 3.85% and could move lower. With inflation below 3%, a real yield is now available from longer term bonds, which has been somewhat rare over the past decade. Although “unexciting” in nature, government bonds are one of the few asset classes that have not been “overearning” in recent years and are therefore reasonable from a valuation perspective and should perhaps play an increasingly important role in diversified investment portfolios.
Important Information
The following indexes are used to report asset class performance: ASX S&P 200 Index, MSCI World Index ex Australia net AUD TR, MSCI World ex Australia NR Hdg AUD, FTSE EPRA/NAREIT Developed REITs Index Net TRI AUD Hedged, Bloomberg AusBond Composite 0 Yr Index, Barclays Global Aggregate ($A Hedged), Bloomberg AusBond Bank Bill Index, S&P ASX 300 A-REIT (Sector) TR Index AUD, S&P Global Infrastructure NR Index (AUD Hedged), CSI China Securities 300 TR in CN, Deutsche Borse DAX 30 Performance TR in EU. Hang Seng TR in HKD, MSCI United Kingdom TR in GBP, Nikkei 225 in JPY, S&P 500 TR in USD.
General Advice Disclaimer
Any advice contained in this document is of a general nature only and does not take in to account the objectives, financial situation or needs of any particular person. Any decision to invest in products mentioned in this document should only be made after reviewing the relevant Product Disclosure Statements. Past performance is not a reliable indicator of future performance. Varria Pty Ltd is an authorised representative of Charter Financial Planning ABN 35 002 976 294 AFSL number 234665