
June 2025: Further share market gains despite policy uncertainty 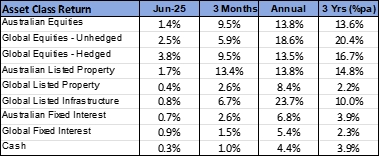
- The rally on global equity markets continued over June, despite renewed tensions in the Middle East and ongoing U.S. tariff policy uncertainty.
- The U.S. dollar continued to weaken.
- Bond yields moved lower, as expectations of a U.S. cash interest rate cut firmed.
International Equities
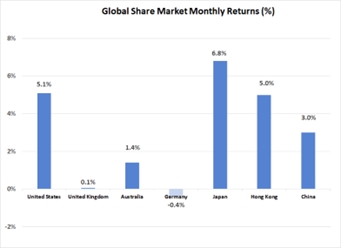 Buoyed by further improvements in earnings expectations, the U.S. share market led global equities higher last month. Adding to investor confidence was the expected passing of the “One Big Beautiful Bill Act” through the U.S. Senate. This legislation provides a source of fiscal stimulus to the U.S. economy and is seen to lower the probability of a recession in the near term. The S&P 500 Index outperformed the global average with a gain of 5.1%. With the exception of Tesla (down 8.3%), the U.S. technology sector made a major contribution to the broader market growth, with the largest stock, Nvidia (up 16.9%) one of the best performers. Returns on the Japanese market were also impressive, with the Nikkei Index gaining 6.8%. There was strong support for Asian markets more broadly, with continued hopes that the region would benefit from a more moderate U.S. tariff program than was announced in April. Gains in Asia contributed to the MSCI Emerging Market Index (up 4.1%) slightly outperforming developed markets. Despite this broader optimism, though, there still remains considerable uncertainty as to the degree of tariff implementation to take place once the 90-day pause in the program expires on July 9th.
After a period of strong growth, European markets did not follow the U.S. and Asian markets higher last month, with both France and Germany posting small negative movements. The U.K market was also flat for the month. This potentially reflected some profit taking by investors, with capital flows being once again re-directed towards the U.S.
There were further tensions and military activity in the Middle East last month, with both Israel and the U.S. striking nuclear facilities in Iran. Although this activity had minimal impact on share markets, there was a significant 7.1% rise in the oil price over June. The spike in the oil price was initially prompted by fears that Iran could take action to close the Straits of Hormuz, which cater for 20% of total global oil trade.
Real assets continued to be well supported, with lower bond yields adding support to both listed property and infrastructure last month. Global listed property was 0.4% higher, with infrastructure gaining 0.8%.
Australian Equities
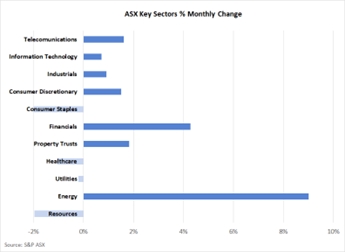 The Australian market advanced over June, however, gains were lower than the global average with the S&P ASX 200 Index rising 1.4%. The energy sector was the standout, with higher oil prices and a takeover bid for Santos (up 16.2%) aiding performance. Financial stocks also made a solid contribution, with CBA (up 5.0%) once again hitting new record highs. For the 2024/25 financial year as a whole, CBA gained 49.8%, which compares to an average of 17.8% for the other 3 major banks.
Outside of energy, the resource sector declined last month. A 4.7% decline in the iron ore price is likely to have been a contributing factor, with the appreciation in the $A also having a negative impact on earnings forecasts. The only other sector to finish in negative territory was consumer staples, with both Coles (down 3.5%) and Woolworths (down 2.3%) losing ground.
Fixed Interest & Currencies
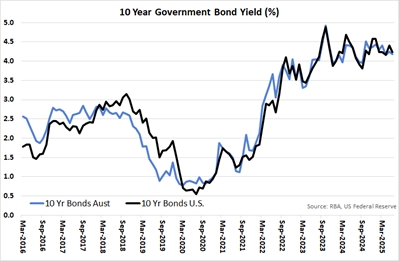 Despite the potential inflationary threat from higher oil prices, global bond yields moved lower over June. 10-year U.S. Treasury Bond yields dropped from 4.41% to 4.24%. Australian longer-term yields experienced a more modest decline, falling from 4.25% to 4.18%. Although there were few central banks cutting cash rates in June, expectations remain strong that monetary policy will continue to be eased around the globe. Opinion is divided as to whether the U.S. Federal Reserve will re-commence an easing program prior to the full impact of the tariff program on prices being known.
The $US returned to a downward trend last month, enabling the $A to appreciate from U.S. 64.4 cents to U.S. 65.5 cents. The $A was also 1.8% stronger against the Yen but declined 1.5% relative to the Euro. The Euro has been the best supported of the major currencies so far this calendar year, having appreciated 12.7% against the $US since the end of December. This is despite cash rates declining in Europe over this period. As such, the Euro appears to have taken on a “safe haven” type status, potentially providing investors with some diversification away from U.S. policy risks and uncertainties.
Outlook and Portfolio Positioning
The 2024/25 financial year was another lucrative period for investors, with double digit returns on equities, and fixed interest benchmarks delivering a margin of more than 1% above cash. Underpinning the positive results on financial markets was the success achieved by policy makers in bringing inflation back towards target levels, without forcing economies into a recession. Complementing this positive economic backdrop was the ongoing advancement in artificial intelligence, where evidence of the technology’s monumental potential to transform and improve business processes and models continues to build.
Notwithstanding the healthy asset class returns over the year as a whole, there were certainly periods of heightened concern experienced. The periods of negative return were triggered primarily by a focus on two alternative sources of risk. Firstly, the risk that bond yields would remain elevated, and that central banks would not be as accommodative as hoped in cutting cash rates, was a major focus of bond and equity markets in the sell-off experienced late in 2024. Secondly, and more recently, the policy uncertainty originating from the new U.S. administration, and the risk that the tariff program will materially weaken economic growth, caused a significant sell-off on share markets over February, March, and early April.
Although financial markets finished the financial year on a very positive trend, it is notable that both risks identified above remain in play. Some form of resolution around the uncertainty over the U.S. tariff program may be delivered shortly, although the actual economic impact of the tariffs will take months to asses. Bond markets too remain vulnerable, with inflation uncertainty stemming from both the U.S. tariff program and oil prices. In addition, the further expansion in the U.S. government deficit, which is being baked in by the “One Big Beautiful Bill Act”, may present challenges as investors will need to be convinced to buy more bonds at current yields to fund the U.S. deficit if a steeper yield curve (and capital loss on bonds) is to be avoided.
Admittedly, the risks discussed above are somewhat U.S. centric and for Australian investors may provide less of a source of direct concern. However, whilst there may be less inflation, policy and economic downturn risks in Australia in the year ahead, it could be argued there is more equity valuation risk here. Australia’s share market rally has matched that of the global average over the past 12 months, despite earnings growth prospects for the majority of our large companies being quite muted in comparison. This has seen price to earnings ratios for selected larger blue-chip companies reach particularly high levels, which adds to the potential for correction should market sentiment deteriorate.
Therefore, in looking ahead to the 2025/26 financial year, a more cautious approach to share markets may be warranted, with particular focus around managing exposures to the U.S. (and the $US) and the more expensive areas of the Australian equity market. Pockets of attractiveness in risk adjusted valuations do remain, with smaller companies (both globally and domestically), global listed property and emerging markets all trading below historical norms in terms of relative valuation. Australian bonds, offering a yield above the cash rate, also offer an attractive return without the same risks accompanying their U.S. counterparts.
Important Information
The following indexes are used to report asset class performance: ASX S&P 200 Index, MSCI World Index ex Australia net AUD TR, MSCI World ex Australia NR Hdg AUD, FTSE EPRA/NAREIT Developed REITs Index Net TRI AUD Hedged, Bloomberg AusBond Composite 0 Yr Index, Barclays Global Aggregate ($A Hedged), Bloomberg AusBond Bank Bill Index, S&P ASX 300 A-REIT (Sector) TR Index AUD, S&P Global Infrastructure NR Index (AUD Hedged), CSI China Securities 300 TR in CN, Deutsche Borse DAX 30 Performance TR in EU. Hang Seng TR in HKD, MSCI United Kingdom TR in GBP, Nikkei 225 in JPY, S&P 500 TR in USD.