
November 2025: Equities recover following brief correction
- Global equities bounced back from a mid-month sell-off.
- Market leadership rotates from technology to defensive sectors.
- Australian shares continue to underperform, as local bond yields increase.
International Equities
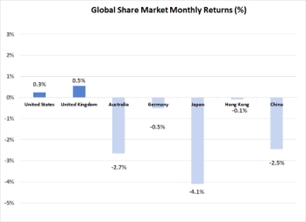
Shifting interpretations around the policy stance of the United States Federal Reserve had a major impact on global equity markets last month. For much of the month, there were concerns that the U.S. central bank would keep interest rates on hold for an extended period. However, these concerns were allayed later in the month, with commentary from the Federal Reserve, and softer U.S. consumer confidence data, pointing towards a higher likelihood of interest rate cuts. Share markets recovered as a result, with the U.S. S&P 500 Index making up all of its lost ground to finish the month 0.3% higher. Despite the strong end to the month for the overall market, there were ongoing concerns over the magnitude capital expenditure being made across the technology sector in Artificial Intelligence related infrastructure. This resulted in technology stock prices falling over the month, with the S&P 500 technology sector dropping 4.6%. Indicating a possible shift in market leadership, the more defensive sectors, such as healthcare (up 10.7%), consumer staples (up 3.9%) and communication (up 6.9%) outperformed on the U.S. market over November.
Outside of the U.S., there were few areas of growth, with European markets again being relatively flat. Following a very strong October, Japan’s Nikkei Index fell 4.1%, as concerns mounted over the new Prime Minister’s apparent willingness to support higher interest rate structures. The Chinese market also continued to pullback from recent gains, with a 2.5% decline leading the MSCI Emerging Market Index 2.6% lower.
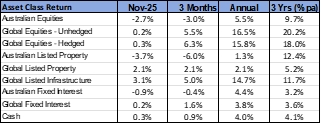
With expectations firming around the likelihood of further U.S. interest rate reductions, real assets were generally well supported over November. The global listed property asset class appreciated 2.1%, with listed infrastructure gaining 3.1%. In Australia, however, there was less support for real assets as interest rate expectations here moved higher. As a result, the Australian listed property sector declined 3.7%, to be now 6.0% lower for the quarter.
Australian Equities
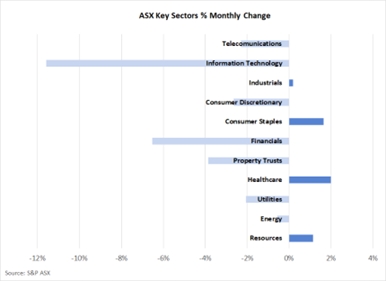
Underperformance on the Australian market continued over November, with the S&P ASX 200 Index falling 2.7%. On an annual basis, the Australian market now lags the global equity average return by just over 10%. As has been the case over recent months, the resource sector remained well supported, with an average gain of 1.1%, bringing the quarterly increase to 9.6%. Although iron ore prices were slightly weaker, stronger lithium and gold prices were a source of support for the sector.
As was the case globally, there was a fall in support for technology stocks over November, with the sector being the weakest performer with a decline of 11.6%. Also consistent with the global pattern was an increase support for defensive stocks, with healthcare (up 2.0%) and consumer staples (up 1.6%) being areas of share price improvement.
The Industrial sector was also given a boost by the news that logistic operator Qube Holdings (up 10.7%) had received a non-binding and indicative proposal from Macquarie Asset Management to acquire 100% of Qube’s shares. Qube has subsequently granted Macquarie a period of exclusive due diligence until 1st February 2026. The rotation away from the Commonwealth Bank continued though, with the bank share price declining 11.2% over the month to be 13% lower since the start of August.
Fixed Interest & Currencies
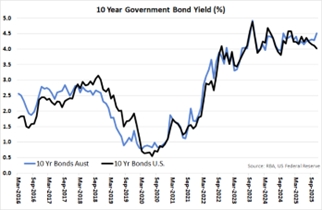
There was a sharp disparity in bond market direction between Australia and the United States over November. Australian bond yields shifted sharply higher as inflation data once again exceeded market expectations. Consumer Price Index data for the month of October revealed an annual inflation rate of 3.8%, which was a 0.2% increase on the rate at the end of September. However, the less volatile underlying measure of inflation shows a slightly more moderate rate of price increase of 3.4%. Market consensus has now firmed to a view that there will be no cash interest rate reductions in the foreseeable future. Bond yields increased as a result, with the Australian Government 10-year bond yield rising from 4.29% to 4.51%.
In contrast, expectations that the U.S. Federal Reserve will reduce interest rates in the months ahead are strong, with increasing confidence of a rate cut contributing to the reduction in 10-year U.S. Treasury Bond yields from 4.11% to 4.02% over the course of November. The 0.49% margin between Australian and U.S. 10-year yields is the largest month end gap in yields since June 2022.
Despite the local rise in bond yields, there was no significant change in the Australian exchange rate last month. Against the $US, the $A was just marginally weaker, moving from US 65.5 cents to US 65.3 cents. Softening iron ore prices and less optimism around the outlook for the Chinese economy may have dented demand for the $A last month. The Australian currency also depreciated against the Euro by 0.4% but was 1.2% stronger against the Japanese Yen.
Outlook and Portfolio Positioning
Indications that the global share market rally was becoming more fragmented in October took hold in November, with a short correction being recorded prior to a recovery over the final week of the month. Two areas of concern appeared to drive the brief correction, with the sustainability of Artificial Intelligence (AI) related expenditures, and the willingness of the U.S. Federal Reserve to reduce interest rates further, being the primary focus of investors over the month.
Although global equity markets finished the month of November marginally higher, there was a distinct change in market leadership, which may have longer term consequences for the period ahead. The sell-off in technology stocks was notable, and perhaps marks a more permanent change in the appetite of investors to continue to back AI related earnings forecasts without additional evidence of tangible and sustainable payoffs from the technology. Also notable was the 11% jump in the healthcare sector last month, which is indicative of the switch in support for areas of the market trading on cheaper valuations that have largely been ignored for much of the past 3 years.
Within Australia, there has also been a pattern of market leadership change. Technology stocks have fallen sharply in parallel with a significant rotation in support away from the Commonwealth Bank, which dropped 11.2% last month. Despite subdued iron ore prices, the resource sector has been the beneficiary of this rotation, along with some selected more defensive industrial names. However, the net effect of the recent change in investor preferences has been negative on the Australian market, with the S&P ASX 200 Index now negative 3.0% over the past quarter. The 10% return differential between the Australian and global equity markets over the past year is significant but probably justified given the lack of domestic economic and earnings growth momentum.
Also negatively impacting the local share market has been the recent turnaround in interest rate expectations. Consensus has rapidly shifted from supporting further cash rate reductions, to the current view, which regards an increase in interest rates in 2026 as a strong possibility. Although the two most recent higher than expected inflation prints justify the central bank pausing the program of interest rate reductions, the change in market expectations now backing higher interest rates next year may have been made a little too hastily. As evidenced in the September quarter National Accounts, the Australian economy is still operating at a lower-than-average rate of economic expansion and there remains a possibility that recent improvements in consumer spending are a temporary, rather than inflation inducing, occurrence.
The change in the market’s outlook for local interest rates resulted in higher longer term bond yields, with the Australian Government 10-year yield of 4.5% appearing to be attractive compared to cash interest rates and some areas of corporate credit. Local bond yields also appear to be offering a more favourable return than the U.S. Treasury equivalents, which are yielding close to 4.0%. This is despite the fact that the U.S. economy has still not hit its inflation target, with tariffs and other areas of policy uncertainty increasing the difficulty of assessing true underlying inflation. In fact, the possibility that U.S. inflation may surprise on the upside, causing bond yields to adjust upwards and equity markets to re-price downwards, is perhaps one of the more significant risks that investors should be aware when considering the investment outlook in the year ahead.
Important Information
The following indexes are used to report asset class performance: ASX S&P 200 Index, MSCI World Index ex Australia net AUD TR, MSCI World ex Australia NR Hdg AUD, FTSE EPRA/NAREIT Developed REITs Index Net TRI AUD Hedged, Bloomberg AusBond Composite 0 Yr Index, Barclays Global Aggregate ($A Hedged), Bloomberg AusBond Bank Bill Index, S&P ASX 300 A-REIT (Sector) TR Index AUD, S&P Global Infrastructure NR Index (AUD Hedged), MSCI China (Composite) in CN, Deutsche Borse DAX 30 Performance TR in EU. Hang Seng TR in HKD, MSCI United Kingdom TR in GBP, Nikkei 225 in JPY, S&P 500 TR in USD.
General Advice Disclaimer
Any advice contained in this document is of a general nature only and does not take in to account the objectives, financial situation or needs of any particular person. Any decision to invest in products mentioned in this document should only be made after reviewing the relevant Product Disclosure Statements. Past performance is not a reliable indicator of future performance. Varria Pty Ltd is an authorised representative of Charter Financial Planning ABN 35 002 976 294 AFSL number 234665